


- HYGEIA
- Services


HYGEIA 2018 Days 365 Active Bed Capacity 315 Inpatient Admissions 16.275 Outpatient Admissions 156.232 Number of operations 15.711 Occupancy Rate 70.48% L.O.S 4,51 Total Operations
2013-2018Year Operations ODS & Central Surgeries 2013 14.942 2014 14.874 2015 13.531 2016 13.490 2017 14.361 2018 15.711 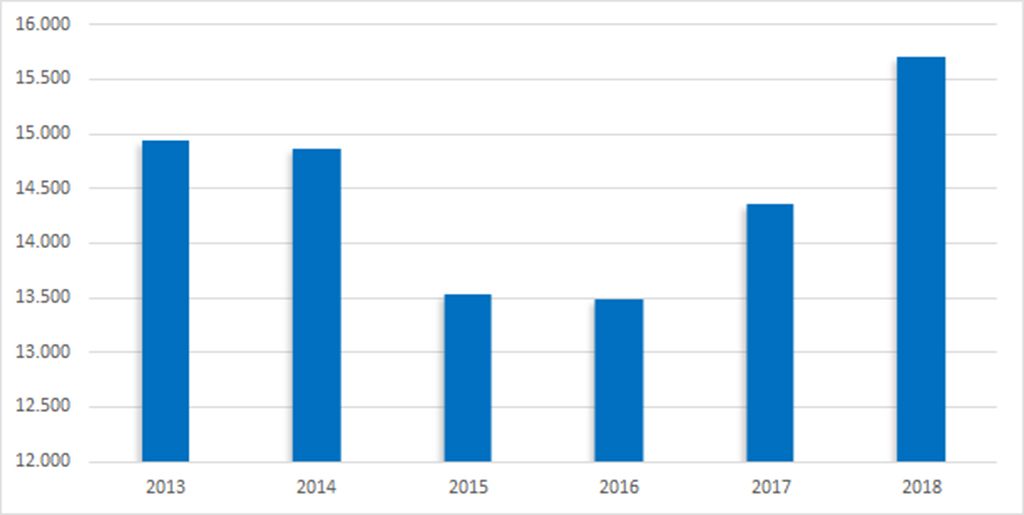
Patient Admissions
2013-2018Year Patient Admissions 2013 17.772 2014 18.073 2015 15.990 2016 15.523 2017 15.660 2018 16.275 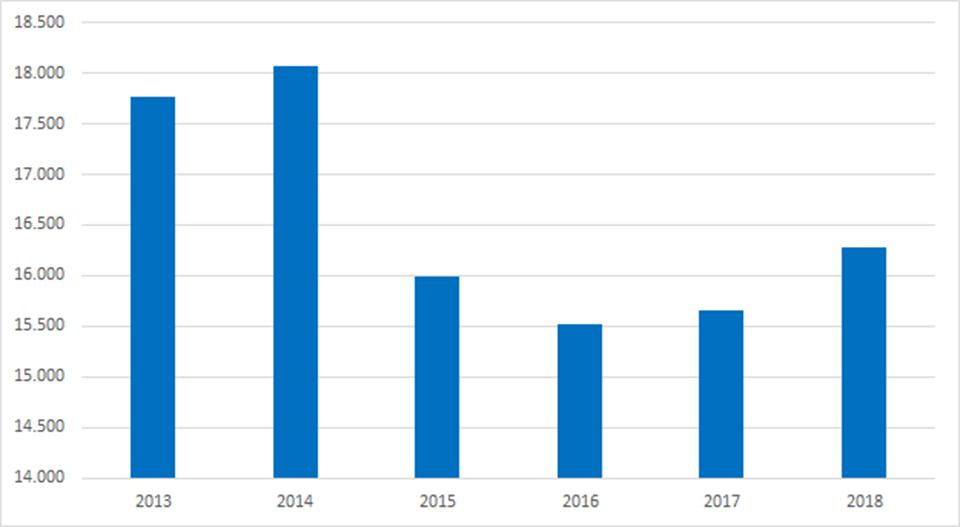
Patient Days
2013-2018Year Patient Days 2013 74.401 2014 74.481 2015 69.975 2016 68.595 2017 70.557 2018 70.486 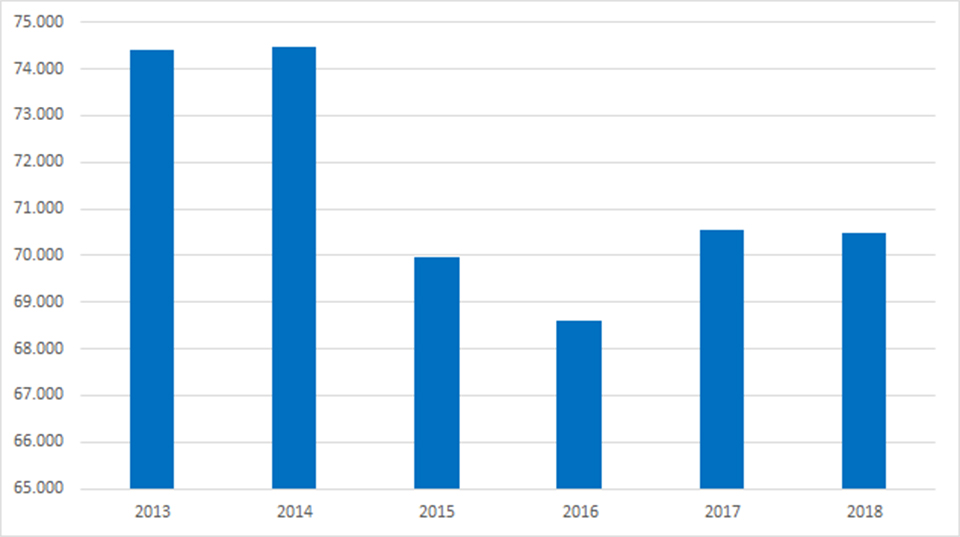
Length of Stay
2013-2018 (L.O.S)*Year Length of Stay 2013 4,19 2014 4,12 2015 4,38 2016 4,42 2017 4,51 2018 4,33 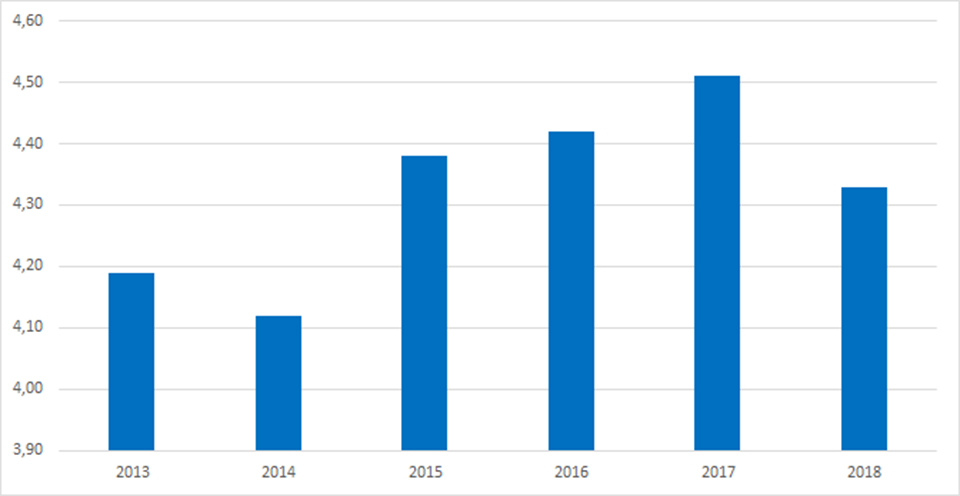
*length of stay: is a term to describe the duration of a single episode of hospitalization

- © 2007-2025 HYGEIA S.M.S.A.

- Services